Watch the Webinar
Now more than ever senior living teams are turning to data to help provide insight and guidance to help manage pressing challenges like workforce staffing, resident acuity, and financial performance. But, organizing all that data and drawing insights that a senior living operations can truly use to address these problems is difficult without the right data management system.
In response, Eldermark has introduced ElderSmarts, the analytics and data management platform designed for senior living that compiles data from every source and solution a senior living community relies on.
In this Leadership Forum Webinar, join Eldermark's Chief Client Officer Mark Anderson as we explore how ElderSmarts empowers senior living teams with truly actionable insights and analytics that help teams address common, challenging operational issues.
Watch the webinar below:
Are you ready to empower your team with truly actionable insights?
We'd love to discuss with you how ElderSmarts Analytics and data management can work at your organization. Let's get a personalized demonstration scheduled for you!

Webinar Transcript:
Mark Anderson:
Hello, everyone and welcome to today's leadership forum webinar, one of our leadership forum webinar series that we offer monthly. I'm your host, Mark Anderson, chief client officer here at Eldermark. Should you want to contact me for any reason, my email here is here, manderson@eldermark.com. We have got a really interesting topic for today, I can't wait to get into our presentation. But before we do, just a few things to go over. Always like to cover a few of these things.
First of all, why are we having these leadership forum webinars? We started this series during COVID and decided to continue them because of their popularity. These are regularly scheduled, we try to have these on the first Wednesday of every month and the idea is to help those in leadership positions across our customers and others that wish to join us learn about technology solutions that can help us achieve our goals as leaders in senior living, to share information and resources that is relevant to our work, especially around maybe pertinent current events or things that are of most concern or top of mind and timely. And then, most important, to support each other in our work.
Couple other reminders. Please let us know here at Eldermark of any key staff changes so that we can update our records here. Those can be sent to support@ eldermark.com and then be sure to read the Release Notes that we send out and other important communications to help you stay on top of what's going on here and any updates to the functions and features within the software that you use.
Couple of updates, mentioned these last month too but wanted to throw out their reminders about some newer features and software functions here offering at Eldermark. The first one is our Peerlytics integration. Peerlytics is a partner software that helps with infection control and antibiotic stewardship management. All the functions and features within Peerlytics are consistent with the requirements of OSHA, CMS, everything is HIPAA-compliant. And for those of you who operate in a regulatory climate that requires a high degree of infection control practices, either akin or close to what is required in skilled nursing, Peerlytics addresses all of that.
And then also ElderForms. This is our new electronic document management solution in concert with our partner technology WorldView. This is taking off like a rocket. If you want to learn more, let us know, we can hook you up with a product champion. ElderForms basically is an electronic document management system that can help you manage all of your forms and documents that you use in serving your resident customers electronically, including e-signatures, and then storage of e-documents within Elder Charts system. So, want to learn more about that, let us know, happy to connect you with someone to get you in the know about ElderForms.
All right. So, enough of that, some webinar notes before we get going. All of you will remain muted during the webinar today. If you have a question, we'd love to hear from you, please use the question feature on your webinar control panel to submit your question and we will get to those as they come in and/or at the close of the webinar, depending on the time available. Also, you will receive a link to a recording of this webinar within about 24 hours or so after we adjourn, so watch your email for that and you are free to share that with your colleagues or others who may be interested in this topic. And of course, you're always welcome to contact myself or our presenters directly via email, we welcome that interaction with you.
All right. So, today's topic. We're looking at data and how your data has the answers to senior living challenges featuring our new data management system ElderSmarts. And to help us with that, I've got a colleague on hand today, Dustin Pease, who's our executive director of data and analytics and welcome, Dustin, can't wait to hear more about what you're working on. So, we're going to hear from Dustin in just a few moments.
Dustin Pease:
Thanks, Mark.
Mark Anderson:
So, just a little bit of background and setting the stage for what Dustin is going to take us through. These challenges of occupancy and workforce issues, financial stability, these were in the forefront even before the pandemic. And then once that pandemic set in, these three challenges were exacerbated. And even though the pandemic is, I guess, over these three challenges remain. Things have maybe become a little better for you in one or all of these areas where you operate but, nevertheless, we are hearing consistently from our customers that they are so challenged in the areas of occupancy, workforce and financial stability.
And then, during COVID, it's almost like someone flipped a switch and, suddenly, more than ever, our customers and senior living in general, because you've seen it in the newsletters and so on that are out there, it's almost like suddenly everybody just needed to get access to their data and to look to their stores of data to help them in their search of helpful information to better understand, not only their current state of what was going on, but maybe looking for some guidance on what would be the best course of action to move towards our desired state.
And so, as the pandemic began to fade, Eldermark was working on a project to design and create a new management system for data for our customers and some new technology where we could pull in data points from all kinds of sources and then organize them in ways that make the most sense for our customers, depending on what it is they wanted to measure or monitor in their work. Again, looking for helpful guidance and insight into how to best manage these systems, particularly around occupancy workforce, infant financial stability.
And so, ElderSmarts is what we call analytics as a service. We are delivering analytics to the customer. Well, what do we mean when we say analytics? This is a term that's thrown around a lot when we talk about data management. And so, just to put us all on the same page and have a shared understanding, I looked to good old Wikipedia, they had a really good summary definition here. And so, when we talk about analytics today and when we talk about analytics within ElderSmarts, we're looking at a systemic computational analysis process of data or statistics. Well, that's a mouthful of a sentence but, basically, here we are looking at data and our look at data then is used for discovering and interpreting and communicating meaningful patterns within the data and you're going to see some really good examples of that from Dustin in a moment.
So, again, it's used for discovery, interpretation and communication of meaningful patterns in data and it also involves applying those data patterns towards effective decision making. And again, we're going to get more of that later. So, how does ElderSmarts work? Well, when you see Dustin's designs, you'll get an idea but basically what we're doing here is we're looking at different data sources, whatever those might be, and it would be based on what the customer wants to measure or monitor the performance of something. And so, we take those data sources and, within ElderSmarts, they're combined and configured in ways that makes sense based on what the customer wants to measure.
And those configured data content sets, we call them, are then pushed to you for your review, insights delivered to you to help you best understand what's going on within your operations. And these configured data sets we are finding now and what we're designing for customers, so far, they are really gathering around these common topics or categories. So, customers are most eager to measure things and get into their analytics around financial performance and the acuity levels of the residents, CRM related data points around occupancy and occupancy trends. Risk management is a big one as well as quality measures and more so now to staffing, of course, and there are others. These are the ones that seem to dominate the requests around data analytics.
So, in putting all this together for our customers, what are some of the questions they're asking? What are the customers that we serve looking to ElderSmarts to help guide their next best course of action? And just summarizing a few of them, how can we best manage resident falls or even how can we best prevent resident falls? What can the data teach us? What are the stories within the data and the patterns within the data that can help us do better in managing resident falls? How much staff do I need on each day of the week and each time of the day? And how can I be sure that residents are assigned to the proper level of care, not only a clinical insight here, but also optimizing revenue. How can we influence the length of stay to keep our residents longer, slow down that resident churn? What do we need to do to achieve our occupancy goals? That one will never go away.
Are we capturing all of the revenue that we are actually earning and how can we measure resident acuity? And then what can we do with that acuity data in applying it to other things that we want to learn about? Resident acuity is a big one. And can we get our data to inform our quality process? Quality assurance performance improvement is, historically, somewhat of a skilled nursing process. We are seeing this aptly creep into senior living more and more and so our customers are interested in monitoring and measuring various quality indicators to help inform their own quality assurance performance improvement processes and ElderSmarts can deliver a lot of insight into that process.
So, when we look at the different needs of these analytics within a hierarchy, I wanted to quickly address the difference between basic reports and dashboards and then how ElderSmarts moves you into analytics. So, if we look at raw data within the database reports within, say, the service-minded reports, for those of you that are users, these are really non-actionable reports. It is information, it is just raw data. And several years ago, we were able to deliver really cool dashboards for our customers that does take that raw data and create some very good transactional reports. But again, these are static, these are templated, they're helpful, for sure, within certain levels of the organization but the insight isn't as deep as how far we can go when we get into ElderSmarts.
As we climb up this pyramid of analytics needs, what ElderSmarts can deliver for us is answering important questions. So, we can deliver descriptive analytics that help us answer that question what is happening here and why is it happening within a diagnostic analytics viewpoint. And once we see why it's happening, then that helps us understand predictively what is likely to happen next if the indicated trend continues as we see in the data and that helps us understand what would be the next best course of action prescriptively.
Looking at a real-life example of that for someone who's a CRM user if we climb up the pyramid, we can start with raw data of just a list of move-ins. Who is moving in to the community, say, the next period of time? So, we've got that list but then, as we move into transactional reporting, say, through the dashboards, now we can look at maybe a trend chart of move-ins by month or per month. Pushing that data further into what ElderSmarts can deliver, now we can get a better understanding of answering these questions as we climb up. For example, community X occupancy has decreased more than the average across our portfolio and the prospect close rate is below the average compared to our other communities. So, that helps us understand what is happening, why is it happening.
ElderSmarts can tell you that, well, it's happening because the number of tours per prospect is now 50% below your average and, if this continues, your occupancy will continue to decrease by X percent if not corrected. And then finally, prescriptively, the data can help us with understanding that, to overcome this trend that is not a good trend, your sales team needs at least 10 tours over the next month to result in occupancy increase towards our goal. So, identifying those patterns, making sense of those and delivering helpful insights as to what is the next best thing to do.
And then a quick look at a clinical operations example. Starting with raw data, we'll start with a list of residents, incident notes and residents medication profile. These are just helpful lists of information or raw data In our dashboards, we can take some of this and make a little bit more sense out of it through incident report totals, a summary of incidents and records of medication administration patterns. We can take that data, push it into ElderSmarts and now we can see more about what's happening. And in this example, we see community A and B have a higher number of fall incidents. Hmm, why might this be happening? The story can go further and tell us that the population in both communities have a higher percentage of narcotics administered than your other communities.
Well, what is likely to happen if this trend continues? The data can show us that, as these narcotic uses increase, falls will continue to increase. So, not just a hunch, not just something anecdotal, but the data can actually just show us whether or not that hunch is true. And then, prescriptively, we can see within the data that these five residents have fall incidents within an hour after taking a narcotic medication. Next best course of action, refer to the physician for medication reconciliation and add task for staff to monitor more closely. So, we've taken these examples from raw data and moved all the way up into action that is informed by the data.
And so, for some great examples, real-life examples of what we're working on and what we are designing within ElderSmarts and how data can be used within ElderSmarts to really provide that insight and guidance as to best course of action and keep us on our toes about what's going on, I'll turn things over to Dustin and he is going to give us a great overview of some of the contents that we're working on, what we're building for current customers that may be a hint about what he's working on for future [inaudible 00:18:31]. So, take it away, Dustin.
Dustin Pease:
All right. Let's see.
Mark Anderson:
I'll just move over. I'll move it over to you.
Dustin Pease:
Are you seeing that?
Mark Anderson:
Yes, sir.
Dustin Pease:
Perfect, okay. Hey, everybody, I'm just going to go through a few different examples of some content that we've been working on. So, the first one I call the tale of two censuses. In this case, we're looking at two different buildings, maybe I'm the regional sales looking in, I'm in charge of these buildings and I'm looking to get the most out of the data. So, in this example, we're looking at two buildings and they have a different trajectory. Obviously, one is going where you want it to go and one is falling down. And so, how can we use analytics and figure out maybe some clues about why they're going in this direction.
So, length of stay is one of the metrics that's involved, important to census and just showing a roll up data. So, starting at the highest level and you would call this perfectly fine, right? It's a value you can see, about a year length of stay and that's for the most recent timeframe. So, this is showing just one data point. It's fine but does it have meaning? I don't know. Is it good? Is this bad? It's hard to tell in this format. So, viewing the data, same thing over time, tells a story. So, now we're looking at that same metric, length of stay, and we're seeing it's actually a pretty bad trend here.
We were, a year ago, averaging almost two years of stay, now we're down to less than a year. And so, looking at just that snapshot, as a leader, you may not know if it's good or bad. So, seeing the same kind of data over time is a really important aspect to looking at data and then diving down deeper into it, that same data, now let's look at the breakdown. So, now we're breaking down length of stay in two buckets. And this is showing us that we've got a lot of residents staying pretty short stays here, zero to three months. What are the steps we can do to improve this? Are we marketing for the right customers? Is pricing a factor? So, short stay, obviously, is going to lead to churn and census is always going to be a challenge.
So, looking at the same data in different ways is one of the ways you can get the most out of your data. And pricing trends over time, a lot of this stuff is there, sometimes people have it in Excel. I call it let's free this data out of Excel and get it to where you can actually look at it. So, now we're seeing the AL in the memory care units, the average rent, the memory care is crept up and this is actually the occupied rent. So, is this part of the problem? It's one of the factors you could use. So, seeing things over time, really, is, I think, where things are going rather than just snapshots. A lot of this data you could get in reports but you're probably looking at one month at a time.
Second use case I'm going to cover is quality measures. It's an important aspect to census, obviously, and just to satisfaction at residence. So, we've built out a scorecard approach, this is showing a few different areas of quality. So, you can see we've got falls, the hospitalization rate, injuries and, when I was going through this with Mark, we both noticed that you can really see a trend in the falls and the hospitalization rate and the injuries. All those spikes seem to go on a similar trade. So, falls is a big driver of all that. So, doing some benchmarking is a thing where you can compare apples to apples and look at your buildings.
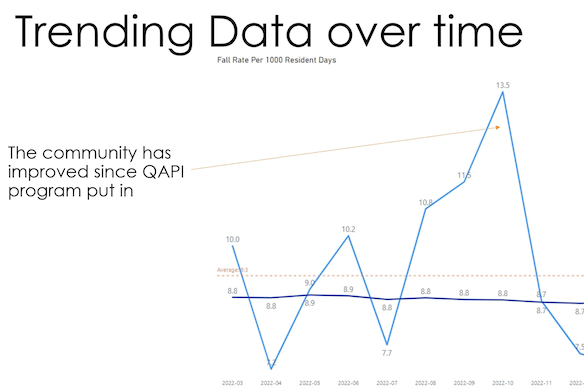
So, we have built out some benchmarking and, really, any metric can be benchmarked, some of them are the most important. So, fall rate is one and we can see here we've got a region, we're looking at different fall rates and we've got the average corporate there. And you can see there's quite a big variance here in this fall rate. In our top community there is just over eight times, almost, as many as the bottom. So, what are the factors that could be driving that? Similar view of benchmarking, this is a little more detailed snapshot view into it and we're seeing that there's just a lot of falls in certain communities and other ones are well below average, so they're doing great.
And so, these kind of reports, you can, as a leader, easily come in here and see is there certain ones that we need to be focusing on. And again, looking at the data over time, it can actually tell us that, in this case, they've improved from where they were. So, if we're looking at this chart, we've got the corporate average sitting down there at about nine and they were hovering monthly. Similar to that, they had a big spike up. So, maybe we had some staff turnover and we, as a company, put in a plan, we discussed it, put in a quality program, focused on it and now we can look at these trends and the charts to see if we ended up improving and so this is actually showing that we could. And that is what I have for you, Mark, today.
Mark Anderson:
Thank you. Dustin, one of the things that ... We don't have the time, we could spend all afternoon on this stuff. First of all, Dustin and I have a lot of fun putting some of the designing in some of these things and making them work for our customers. But when I think about the different stories that are told, one of the things that we're doing is layering some of this stuff, too. So, here we see, in the quality measures on the screen now, we don't really have to layer these over each other to see the patterns here. You mentioned we noticed right away and this is all just the identified data, so we didn't make this stuff up.
And so, if you look at the shape of these graphs, they are very similar in when they are spiking and when they're dropping into a valley for falls, hospitalization rate and injuries. Some things to be learned here. Resident acuity, your earlier diagram on length of stay, one of the things that would be interesting to do at that community would be to look at acuity trends upon admission and layer that over your length of stay because maybe one of the stories that the data can teach us is that we might be admitting good, qualified leads but, over the last year, our acuity upon admission has gone way up.
And I'm guessing, for a number of our webinar participants today, they may agree with that observation if that was born in the data. I think I'm hearing too in our networks that resident acuity post pandemic is definitely higher for most admissions than it was pre-pandemic. Other things-
Dustin Pease:
[inaudible 00:27:47]
Mark Anderson:
... maybe talk about too, Dustin, maybe some other examples that we can talk about that you're working on and then maybe what we're looking at as far as benchmarking. Because it's always great to identify the patterns and what's going on in house but also to be able to see where do we stack up compared to the rest of Minnesota or where do we stack up compared to the country.
Dustin Pease:
Yeah. So, what we're doing, and the more we go and the more groups are willing to contribute data into it, is having a pool of benchmarked data and anonymize certain aspects. But we would have census, fall rate, all those top metrics, pulling that in from a wider Eldermark base as well as having ... You can see here we've got an average line. But there's industry averages and so we're working on having the industry average be available here as well as an all Eldermark average. So, you can see is, your corporate average, how is that compared to the wider world and maybe it's regional, so California versus Minnesota might be different averages. And once you have established all these data points, it opens up a lot of use cases for doing alerting.
So, you could put in some thresholds and say, "If I am seeing an average rate of eight," so we're at 7.5, "If I've seen an average of eight, I want to get an alert." And so, doing push analytics is really the part that, I think, adds a lot of value into this. So, instead of having to go hunt into dashboards and manually doing that, the system is always sitting there watching and, based on thresholds, you can push out an alert and say we had these falls and this maybe was some of the precursor information around it. So, did they have med changes, things that actually could be timely to help rather than ... Instead of logging in, go in on your dashboards, it's more of a pushing. So, thresholds, doing alerts, that's, I think, where I see it going.
Mark Anderson:
Yeah, thank you for that. A question has come in from a participant about will ... Basically the question is around will ElderSmarts replace dashboards as we see them in the legacy product? And you may have a comment on that, Dust, but I'll address it first. And that is this is a common question that comes up when we are introducing ElderSmarts to a customer and I guess I look at it this way. If you're a user, you understand that there are certain reports within your database itself and then, if you are a dashboard subscriber, you understand what's available within dashboards. And I guess the answer is I think it depends on your role within your senior living organization but also what it is you want to accomplish.
If you just need basic transactional data like lists and things, you can get great outcomes of that from your database, in the basic transactional reporting. I think dashboards will always have a place, they are a real time snapshot of what's going on right now and there are a lot of useful applications to what dashboards can deliver within various layers of your organization. And we even created templates for role-based dashboards depending on your role within your senior living communities' organizational charts data.
I think what ElderSmarts does is it takes this data access to such a different level because of the insights that are provided into decision making. Not that ElderSmarts is really only for top leadership, but it is definitely designed for those that are wanting to make the best informed decisions based on the data that's available to them from the various sources of the systems that they use to run their company.
So, I think dashboards will always have an important role, however, with the introduction of ElderSmarts, perhaps for some people, ElderSmarts will take over the place of dashboards in some respects. I guess we'll know as more time goes on but do you have any comments, Dustin, about dashboards versus ElderSmarts?
Dustin Pease:
Yeah, I think they are complimentary. One of the areas where ElderSmarts opens up is actually having a data warehouse that you can connect into the broader world. So, dashboards are there and, as a user, you can come in and see it and you can export a snapshot. With ElderSmarts, it is a data warehouse that can be connected to internal systems, it could be a bridge to vendors. It's a way to maybe limit the data and say I know you want certain data, we can have a data lake, whatever you want to call it, but you can basically have an access to just certain data rather than maybe giving a full access to everything to other vendors. Or if you have internal tooling, what you're looking at here is our visualizations but some groups do want to pull into their own systems, their own analytics so this does open that up. So, that's a difference to dashboards.
And then the other part is the customizing. So, dashboards is 250 some widgets, there's a lot of content there, but it has got a fixed list of metrics. And in ElderSmarts, we encourage more of a customizing where you can see this dashboard looking thing here. But if I want to move things around, I want different metrics, we can actually ... Probably, it may already be in our menu of analytics or it could be something we could add. So, it's a little bit outside of the normal software flow of putting in a request, I want a new dashboard, I want a new X, Y, Z and it may take a long time for that to get back to you. Whereas, here, it's in analytics, we can probably spin that up in a faster way.
And then third is doing customized push reports, there's a ton of options that we can do. So, you could do daily snapshot, you could even have a little mobile CEO view, CFO view where you are just, "I want these two metrics every day, I want it to fly into my email inbox, I just want to see it and look at it," or weekly type of snapshot. So, we want to look at this census and, really, it's a mix of different metrics. What we can do is create that and it can be pushed to each community or regional directors and then monthly even quarterly type views as well. And I think one of the audiences is the investors, not just the directors and corporate staff, but the ownership groups. They may have a different view, they want certain things, they don't want to log into dashboards.
So, I think there is a lot of use case for just having the ability to push specific combinations of things out to people.
Mark Anderson:
[inaudible 00:36:22] I think we've got some examples and, Dustin, you've got the closest connection to them but we also have some customers that have a staff person or a contracted person that's helping them manage their data. And we've seen some examples of how applying ElderSmarts can really help people like that get more done. One of those stories where ElderSmarts can just help them get more done in managing their data much faster, much more efficient than other systems out there?
Dustin Pease:
Yeah, definitely. There's a lot of reports in Eldermark, there's, I don't know, maybe 200 reports, there's a ton. A lot of reports, people love them but they have to go into it and it's per community. So, maybe they go in and look at the report, export it, they might put it in Excel and slice it and dice it. That kind of thing can be part of this data model and it can be something where we actually aggregate that all for the people and just save them the time of having to go and export data, put it in Excel. This could be something where it's aggregated and the things that you care about, if it's transactions or the monthly rent, whatever those things that you want to use in your other reporting, you could pull from here.
So, I think it will automate and just make life easier for the data people that sit and probably comb through reports in the main software
Mark Anderson:
For sure. I remember, when I was using Eldermark as an operator, pulling stuff in, pulling data into Excel and how time-consuming that was. Where were you 10 years ago, Dustin, with this? I could have used this every day, for sure. [inaudible 00:38:28]
Dustin Pease:
Automation is a big focus and we're always looking for feedback on what things are the highest value automation candidates and then that's what we target. So, certain reports and certain data points of what are the most actively requested things and give a lot of communities and a lot of reports, it does add up to a lot of time. So, I would prefer that we can give you that data and you can actually spend your time analyzing it rather than just doing the mechanical export and save and combine and then do it every month.
Mark Anderson:
Right. So, most of our current customers are aware that we're working on a modernization product with our whole Eldermark platform. There's a question from a participant on accessibility to ElderSmarts and that is this going to be just part of the general login to the modernized platform or will it always be an external login like it is now. I don't know if I have an answer, I know currently it's separate. What are you understanding on that, Dustin, or maybe we can't answer that yet?
Dustin Pease:
I don't know if we can fully answer it but the way I think about it is there may be certain things that are super commonly requested and those probably end up in the main product. So, it may be a proving ground for some, it's like, "I just want this and this and this. I want to just have that be in the product." So, I think this will probably feed the product and what's in there but I do think there are features to this that probably would stay unique to it because this is not just Eldermark data that we're trying to talk to, so there may be other platforms out there that you're connected to.
And so, it's probably always something that you would need a little bit of fine tuning what you want to actually connect to, staffing, QuickBooks, whatever, other different systems. It's always going to be an independent data-based data warehouse where it's talking to Eldermark, both the current Eldermark, the modernized version, plus whatever other platforms we end up integrating with.
Mark Anderson:
Yeah. And as we look to wind things down, let's touch on that just for a moment. As we think about that earlier diagram with pulling in data from different sources, to Dustin's point just now, one of the main purposes of ElderSmarts is to, not just pull in data from your Eldermark platform, but to be able to pull in data from other systems that you use to run your business and combine that with the Eldermark data in ways that make sense. For example, one of the examples that we listed earlier on questions that customers are asking was around staffing and that is how many staff do I need on each day of the week and different times of the day based on available staff as well.
And so, part of that project will involve bringing data in from that customer's time and attendance software so that we can combine that with resident acuity data and service demand data and scheduled service data and all that to help provide that insight as to on what days of the week and what times of the day is our service demand and resident acuity such that we can create meaningful and efficient staffing models to ensure that we're not overstaffed or understaffed, that we have adequate staff on duty and that we are being good stewards of these staffing resources based on that data that's available to us.
So, just wanted to highlight that. ElderSmarts, part of the design of that is to pull in data from other systems as well. I don't know if you want to add anything to that, Dustin.
Dustin Pease:
I think that it unlocks some different value. It's like one plus one equals three because, if you've got your staffing system and you've got Eldermark and you can do reporting in both, can we take those two data points and have a different combined, whatever, metric makes sense. So, staffing by acuity, that's an area that we're working on is how do I optimize the workforce. And so, by getting the different feeds of data, both in your real-world data of who's checking in and clocking in versus the resident schedule. And so, I do think there's a lot of good value for that combined that you would have a hard time hitting, you'd have to probably do a lot of manual offline work.
Mark Anderson:
Yeah. Well, we're so excited about where ElderSmarts is headed. We've got so much going right now and I just see this evolving more and more. And I think, Dustin, we're going to need to bring you back to this forum webinar series in a few months and talk more about what else has been going on within ElderSmarts for our customers. It's already very exciting in its debut and I think it's just going to get more and more exciting here down the road as we learn more from our customers about what's most important to them, what are the most important insights they need to help guide and direct their decisions within especially these challenges of workforce and financial stability and occupancy.
Thanks a million, Dustin, for joining us today. I'm just going to have you go to, as long as you've got the control, if you could just go to that last slide about next month. Thanks, everybody, for joining us. Next month, our leadership forum webinar is on Wednesday, April 5th at 12:00 Central Daylight Time. We will be on daylight time by that time and we've got a really great event scheduled. We've got four Eldermark customers who are using our ePay feature within our billing module and going to have a great panel from four customers using ePay to talk about how ePay is helping them, not only with cash flow, but just in general AR management and especially customer convenience.
So, really looking forward to hearing from our customers about their great experience with our ePay feature. Again, thank you everybody for joining us today, appreciate it. If you have questions that you think of after we adjourn, feel free to email me at manderson@eldermark.com. Hopefully we'll see you again next month, thank you so much. And again, thank you, Dustin, really appreciate you joining us today.
Dustin Pease:
Yeah. Glad to be here, Mark. Thank you.
Mark Anderson:
All right. Thanks everybody for your good work.
Dustin Pease:
All right, bye.
Get Awesome Senior Living Content Delivered Straight to Your Inbox!
Posts by topic